
Turn live social data into answers that drive your team’s next move, with every metric traceable to the video behind it.
Dashboard Builder turns live dig data into the dashboard your question demands, whether you’re tracking a launch, competitors, or overall brand health. Because dig reads what’s said and shown inside social video, you see the real conversation, not just the text wrapped around it. Every metric traces back to the posts behind it, so you can see exactly what’s driving the signal. When the question changes, the dashboard changes with it.
Dashboard Builder comes with ready-made views for launches, competitor sets, and overall brand health, so your team never has to start from scratch. Need something more specific? Build a custom view using the same live dig data and components, shaped around the question your team needs answered.
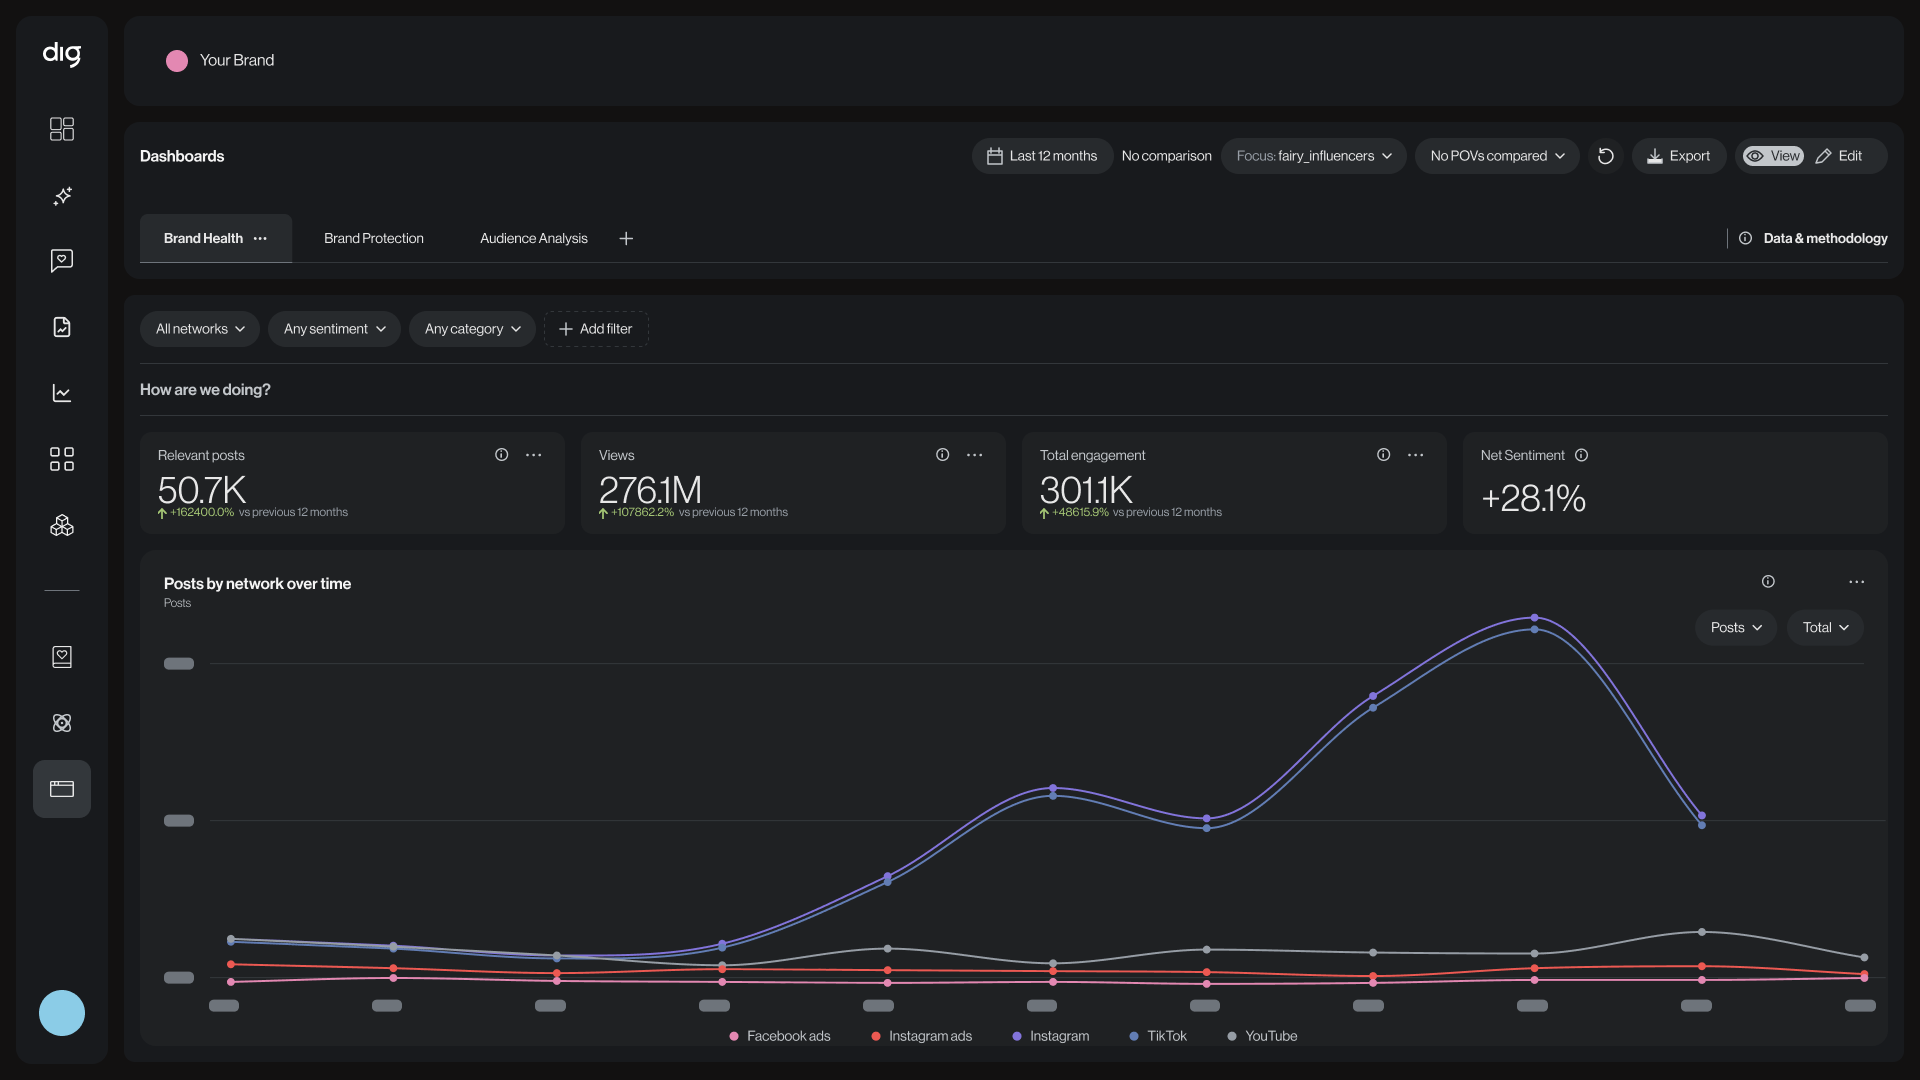
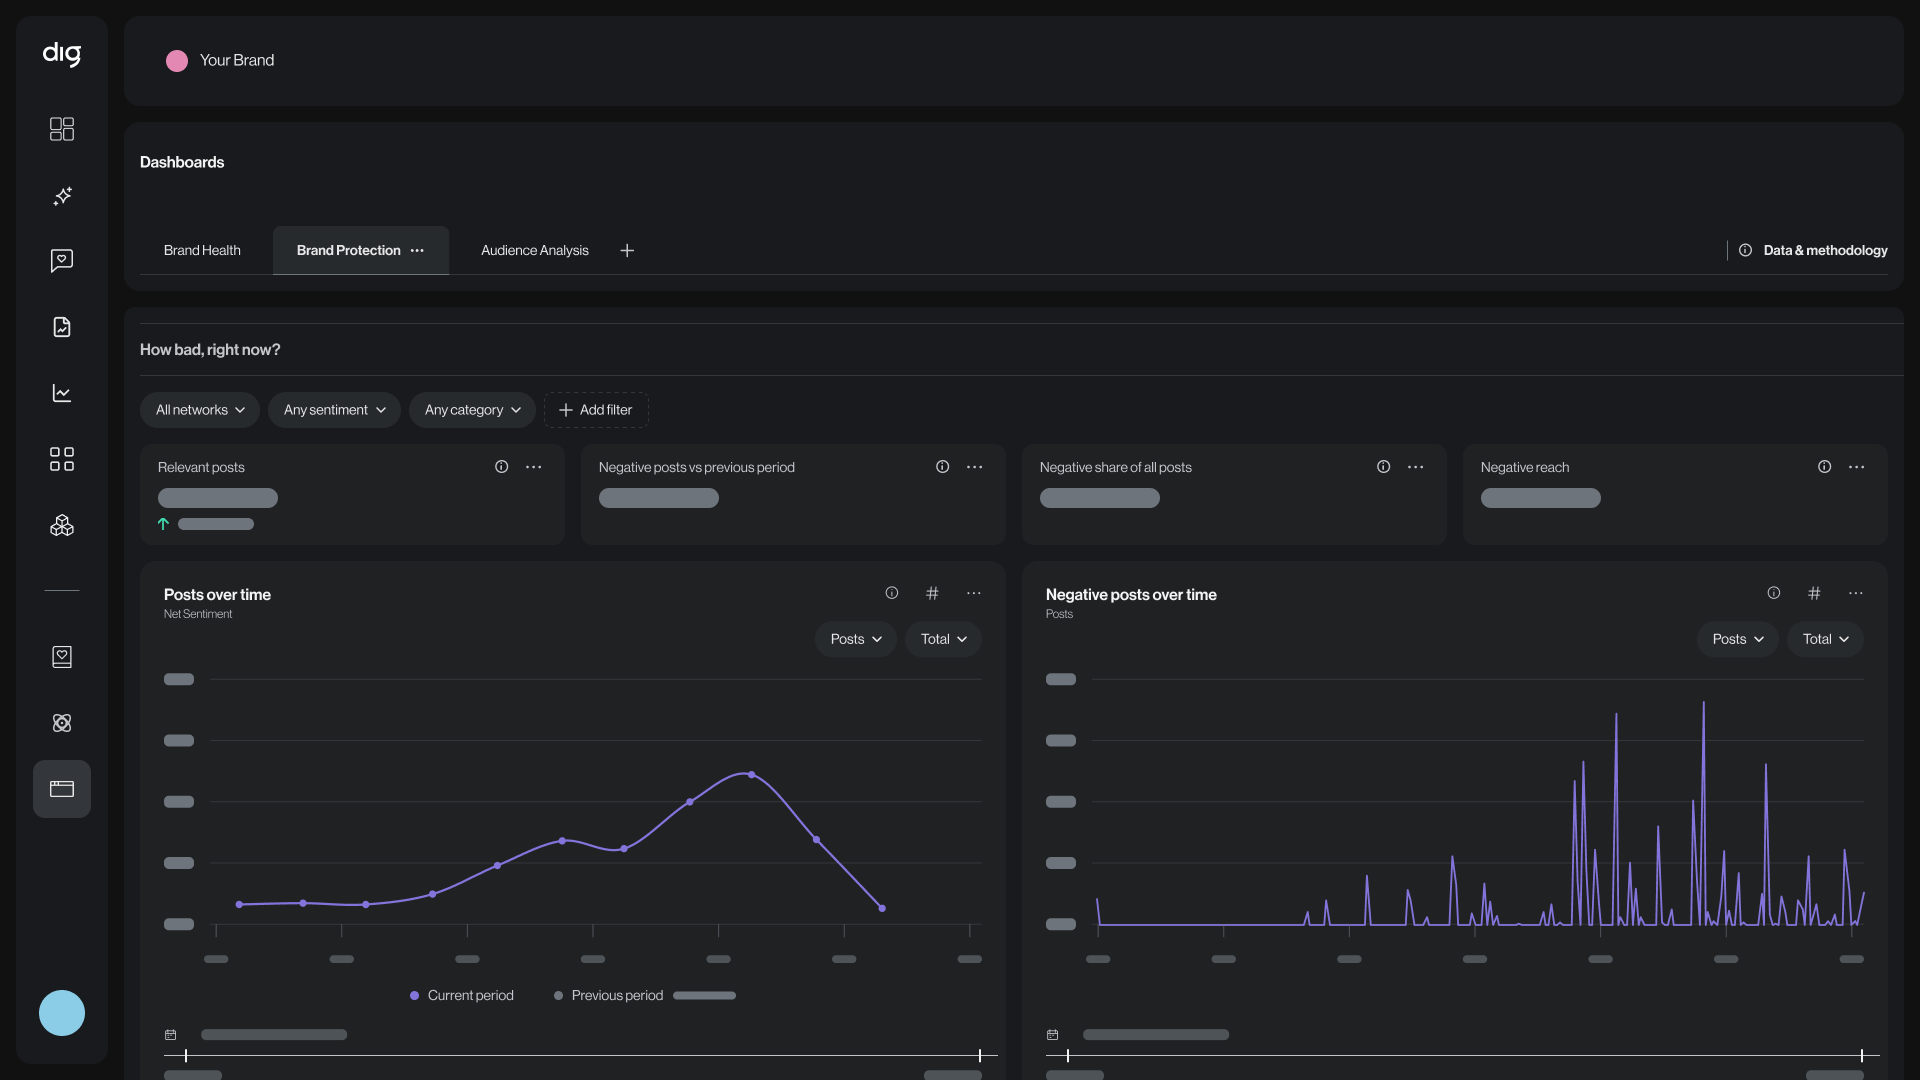
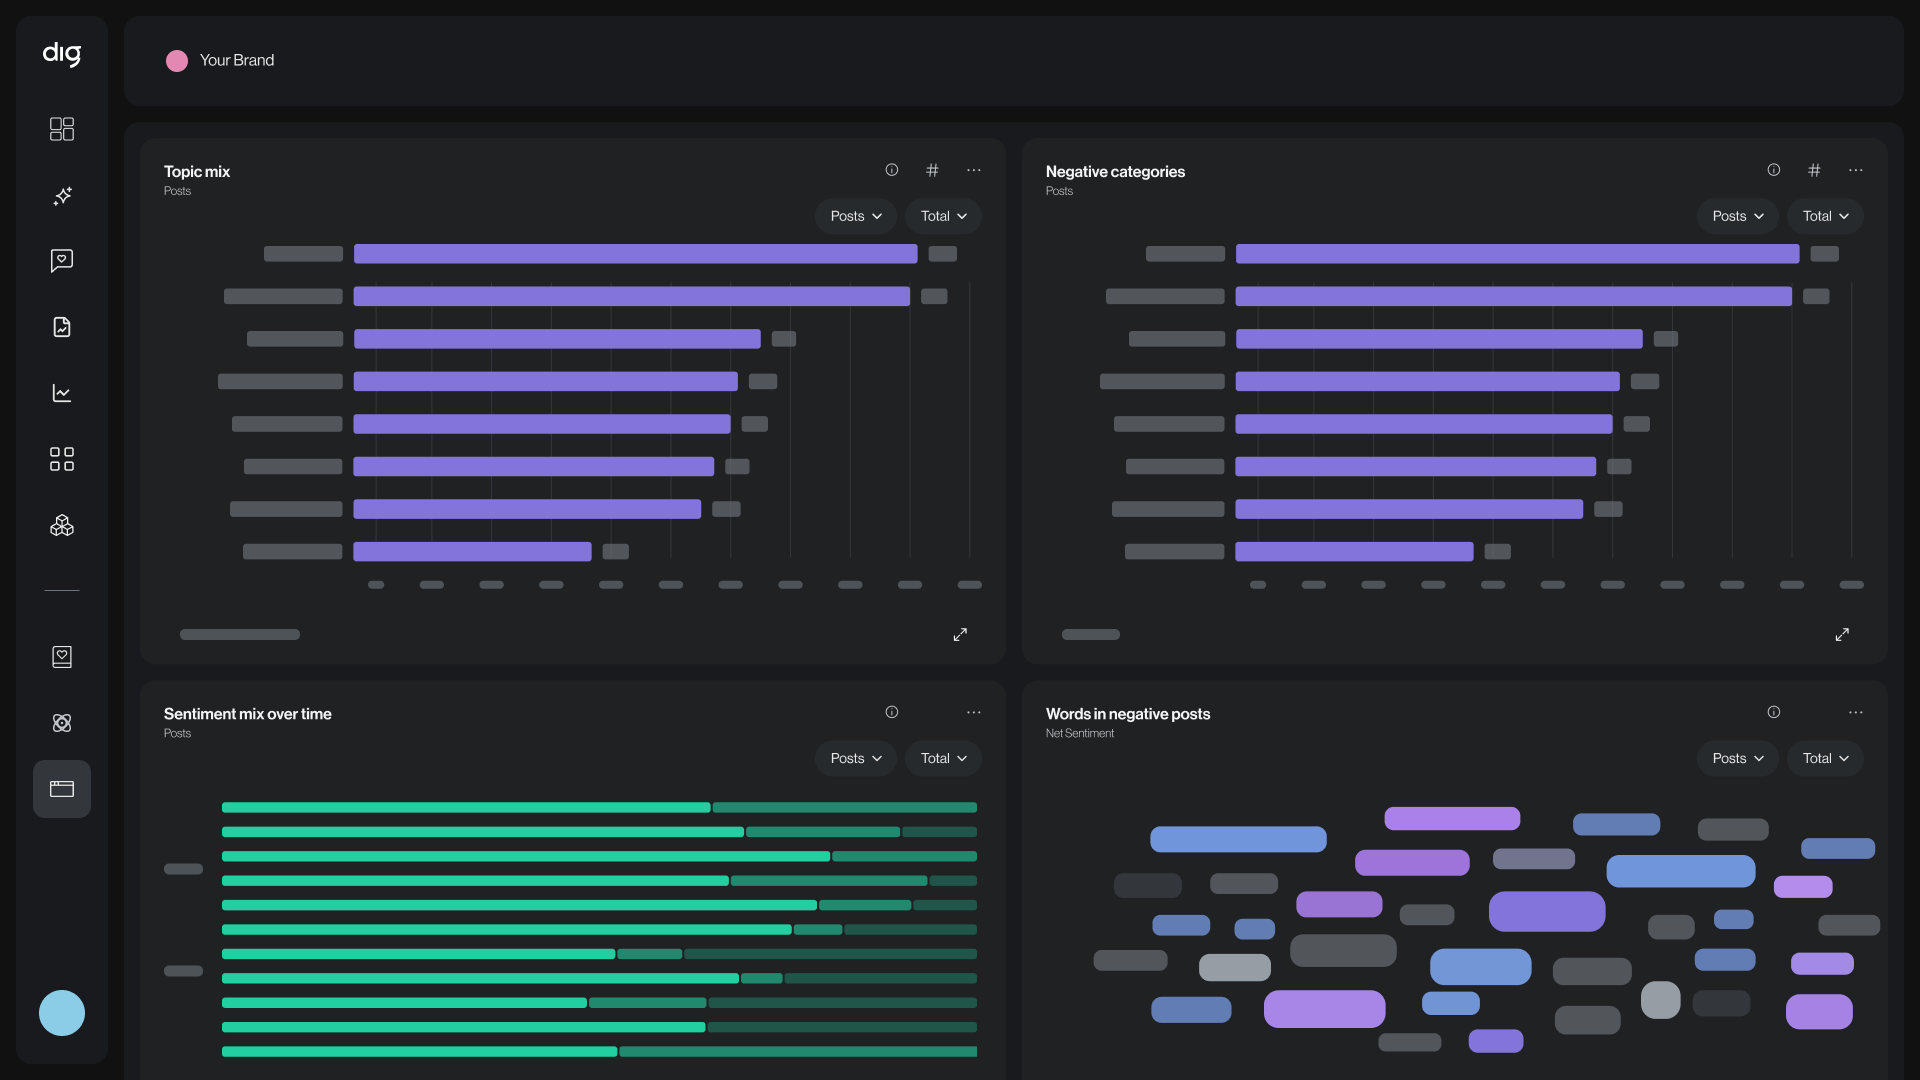
Bring KPIs, charts, tables, word clouds, and live mention feeds into one view. See volume alongside sentiment, share of voice alongside the creators driving it, and key metrics alongside the social video behind them. Instead of reporting a number and explaining it later, the context is right there.
Every metric can be traced back to the posts behind it, including the video, comments, and creator. A sentiment shift is no longer just a line moving on a chart. You can open the clips driving it, understand what changed, and show stakeholders the evidence behind the number.
The questions around a launch in week one will not be the same in week three. Adjust the date range, widgets, competitors, or focus as the conversation evolves. Everyone works from the same live dashboard, so Brand, Comms, Insights, and Marketing are looking at the same picture, not comparing exports from different moments.

Dashboard Builder is built for teams that need to know what people are actually saying, showing, and feeling on social, not just what gets captured in a monthly report. Brand and Marketing can track perception and performance. Comms and PR can follow narratives as they move. Insights and Research can dig into the evidence behind shifts. Agencies can build views around the questions their clients are asking.
Different questions, different views, and the same live social video intelligence underneath.
dig reads what's spoken and shown inside video rather than only the text around it, so your social listening analytics reflect the content itself, and each metric stays connected to the posts it came from.
Yes. Any metric opens into the underlying posts, with the video, the comments and the creator attached, so a figure can always be traced back to the source it came from.
KPIs, charts, tables, word clouds and mention feeds, arranged into a view for a launch, a competitor set, overall brand health or any other question a team is working on.
Use Dashboard Builder with your own data and see what’s happening, what’s driving it, and the posts behind it.
See for yourself